One of the first tasks of this project, is to measure accurately the muscle activation of the muscles of the arm. By observing these activations we are trying to understand the intention of motion of a patient which we need if we want to provide assistance. The muscle activation by itself is not so useful, but when combined with knowledge of the biomechanics of the arm, then we can translate muscle activation into motion. This we achive through a musculoskeletal model.
A very simple musculoskeletal model
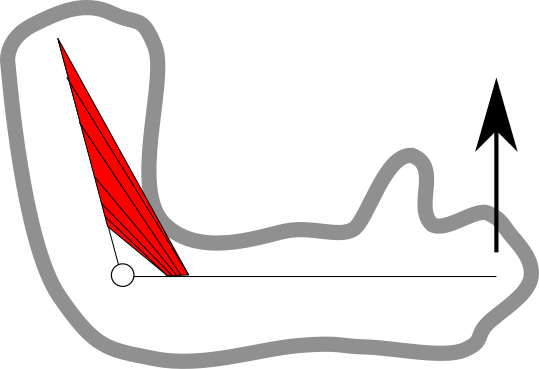
Illustration of the human arm. In red we see the biceps muscle. When the arm is in this configuration, then we can predict that the hand will move upwards when the biceps muscle is activated. This is the role of the musculoskeletal model: to relate muscle forces and motions.
Capturing the EMG signals is not a trivial task. We typically do it with surface patches that stick on the skin (although there is the invasive variant with needles inserted inside the muscles! ), and measure voltage difference between the muscle area and a neutral area on the body (typical a bony surface). However, this potential difference is very small (from 50μV to 100mV) and very very noisy, as it is produced by the firing of individual muscle fibers. Since these fibers do not activate all at the same time and they don’t do so with an equal intensity, the signal appears almost random. And of course, the acquisition system adds more noise due to imperfections in the circuitry.
However, some really smart people have done extensive research on how to quantify muscle activation. By doing a literature review, I understood that the signals can be safely filtered between 20Hz and 450Hz, as the principal components of the muscle activation are within this range. And then, in order to extract an overall muscle activation from the filtered signal, we can calculate either the Root Mean Square (RMS) or Absolute Mean Value of the signal. These two measures are somehow counting how many and for how long are the individual fibers active, which is shown to be correlated to the force that the muscle produces.
In the video below you can see a demonstration of the acquisition and signal processing program that I wrote. I am currently limited to measuring just four muscles, but soon we will be able to capture almost all the muscles of the upper arm (which we need!). In the video you see two graphs: The one below shows the filtered EMG signal, while the one on top shows the RMS of the signal for the four muscles. If you pay attention, you don’t really see much happening in the graph below, while on the top you can see spikes when I am activating my muscles. White corresponds to biceps, red to triceps, green to the deltoid and cyan to the flexor Carpi Radialis. You can get a very nice visualisation of the muscles and an explanation on their function on this wonderful interactive body atlas.
So, now that I am able to measure individual muscle activation, I need to start working on the second part of the project, which is the detection of the posture of the arm. If I want to know where my arm is going to be when a muscle is active, then I definitely need to know where my arm is on the first place :)
So stay tuned for some updates on this soon!
